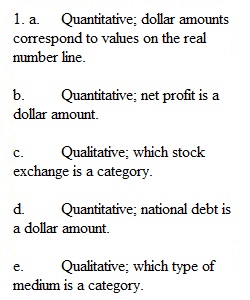


Q 1. Below we list several variables. Which of these variables are quantitative and which are qualitative? 2. Explain the difference between a census and a sample. 3. Classify each of the following qualitative variables as ordinal or nominative. 4. Below we give the overall dining experience ratings (Outstanding, Very Good, Good, Average, or Poor) of 30 randomly selected patrons at a restaurant on a Saturday evening. Click here for the Excel Data File Outstanding Good Very Good Very Good Outstanding Good Outstanding Outstanding Outstanding Very Good Very Good Average Very Good Outstanding Outstanding Outstanding Outstanding Very Good Outstanding Good Very Good Outstanding Very Good Outstanding Good Very Good Outstanding Very Good Good Outstanding ________________________________________ (a) Find the frequency distribution and relative frequency distribution for these data. (Round your relative frequency answers to 3 decimal places.) b) Choose the percentage bar chart for these data. multiple choice 1 • Figure C is correct • Figure A is correct Correct • Figure B is correct Figure A Figure B Figure C (c) Choose the percentage pie chart for these data. multiple choice 2 • Figure B is correct • Figure C is correct Correct • Figure A is correct Figure A Figure B Figure C 5. Consider the following data: 26 48 50 40 44 33 26 47 49 26 39 22 25 26 31 29 51 28 27 49 51 42 41 33 45 24 36 50 ________________________________________ (a) Find the number of classes needed to construct a histogram. (b) Find the class length. (Round your answer to the nearest whole number.) (d) Tally the number of values in each class and develop a frequency distribution. (Round your midpoint and percent answers to 1 decimal place.)
View Related Questions