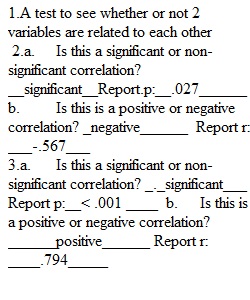


Q Turning in Assignments: Submit this Worksheet to the CANVAS assignment, with your answers typed in red text. Lab 9: Correlation The purpose of this lab is to help you understand how to conduct bivariate correlations. 1. What is a correlation? Below are 15 ACT scores with GPA values. Enter this data: ACT Score GPA 1 GPA 2 10 3.8 2.5 12 3.4 2.2 13 2.4 1.8 14 3.4 2.6 14 2.54 2.33 16 3.20 2.80 18 2.44 2.49 19 2.6 3.0 20 3.1 3.12 22 3.6 3.9 26 2.66 3.08 26 2.12 3.85 26 2.6 2.9 27 2.8 3.4 30 1.9 3.6 Refer to the demonstration video for help interpreting SPSS output. Please note, the video uses different data. You will need to open the Lab 9 SPSS Output to answer the following questions. 2. Look at your output for the correlation of ACT score and GPA 1. 3. Look at your output for the correlation of ACT score and GPA 2.4. Which correlation was stronger? 5. How do you know?
View Related Questions