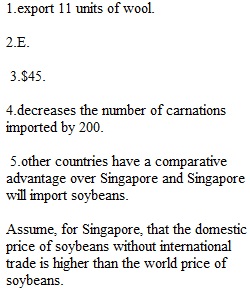


Q Question 1 0.5 / 0.5 pts Figure 9-1 The figure illustrates the market for wool in Scotland. Refer to Figure 9-1. With trade, Scotland will Question 2 0.5 / 0.5 pts Figure 9-16. The figure below illustrates a tariff. On the graph, Q represents quantity and P represents price. Refer to Figure 9-16. Government revenue raised by the tariff is represented by the area Question 3 0.5 / 0.5 pts Figure 9-1 The figure illustrates the market for wool in Scotland. Refer to Figure 9-1. In the absence of trade, the equilibrium price of wool in Scotland is Question 4 0.5 / 0.5 pts Figure 9-6 Refer to Figure 9-6. The imposition of a tariff on carnations Question 5 0.5 / 0.5 pts Assume, for Singapore, that the domestic price of soybeans without international trade is higher than the world price of soybeans. This suggests that, in the production of soybeans,
View Related Questions