Student Solution

-->

"Education is the most powerful weapon which you can use to change the world”
– Nelson Mandela

1 University

1 Course

1 Subject

2.3 Data Assignment

2.3 Data Assignment

Q Running head: 2.3 DATA ASSIGNMENT 1 1. Using the data in Table 2.3 in the textbook(Springer/Hunt Library), Links to an external site.recreate Figures 2.3 and 2.4 from the textbook. 2. You have some data that was collected in Module 1. This was time-series data. Create a graph of the first data set (that was the entire series collected). Take a look at the plot you created. What do you see? What can explain any issues/trends you note? (Hint: Don’t make addressing this question harder than it should be; this is not a trick question.) Save your assignment using a naming convention that includes your first and last name and the activity number (or description). Do not add punctuation or special characters. Submit your assignment by the end of the module week. This activity supports Module Objective 2 and Learning Outcomes 5 & 9.

View Related Questions

Solution Preview

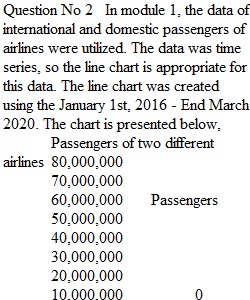
Question No 2 In module 1, the data of international and domestic passengers of airlines were utilized. The data was time series, so the line chart is appropriate for this data. The line chart was created using the January 1st, 2016 - End March 2020. The chart is presented below, Passengers of two different airlines 80,000,000 70,000,000 60,000,000 Passengers 50,000,000 40,000,000 30,000,000 20,000,000 10,000,000 0 20162016201620162016201620172017201720172017201720182018201820182018201820192019201920192019201920202020 Year DOMESTIC INTERNATIONAL The graph above depicts the fluctuations in passenger data for the five successive years; We can see changes in the trend throughout these particular years. The chart shows that domestic passengers increased slightly over the first quarter of 2016. It has been observed that international passengers negligibly fluctuated throughout the first quarter of the 2016. There are many fluctuations in the domestic passengers as compared to international. The graph shows that the domestic and international passengers started diminishing after 2019. The reason for this might be due to the dealing representative's improper behavior, as the customer becomes demotivated due to the avoidance of the client and the lack of proper response.