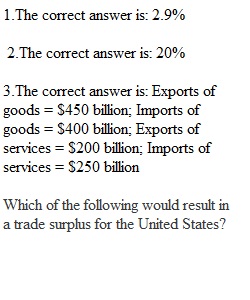


Q Question 1 Correct Mark 1.00 out of 1.00 Flag question Question text CPI Table Year CPI (1982-1984 = 100) 2010 175 2011 180 Refer to the table above. Suppose that the data in the table above reflect price levels in the economy. What is the inflation rate between 2010 and 2011? Question 2 Correct Mark 1.00 out of 1.00 Flag question Question text CPI Table Year CPI (2010 - 2012 = 100) 2020 100 2021 120 Refer to the table above. Suppose that the data in the table above reflect the price levels in the economy. What is the inflation rate between 2010 and 2011? Question 3 Incorrect Mark 0.00 out of 1.00 Flag question Question text Which of the following would result in a trade surplus for the United States? Question 4 Correct Mark 1.00 out of 1.00 Flag question Question text If national saving decreases, Question 5 Correct Mark 1.00 out of 1.00 Flag question Question text The balance of trade includes trade in
View Related Questions