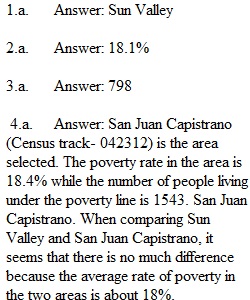


Q Maps Exercise Poverty in America: The first link we will look at presents data from the U.S. Census showing 2012 poverty levels in the United States. The unit of analysis is a Census Tract, which is smaller than a zip code and has a maximum population of 8,000. http://www.nytimes.com/newsgraphics/2014/01/05/poverty-map/ Locate the census tract somewhere else in the country. You’ll simply need to double click on the area and it will start zooming in. After a few rounds of this, you’ll see it begin to supply you with different tracts to click on and a small window will appear with the necessary information 1. In what city is the census tract you selected located? 2. What percent was in poverty?3. How many people were in poverty? 4. Now, click on an area in Irvine and compare to the one you selected. If you originally clicked on a census tract in Irvine, then select one in Santa Ana. How do they differ?5. Scroll around the map in outlying areas and see if you find a census tract with the notation “Low Population Area.” Why do you think the area does not show the poverty data?
View Related Questions