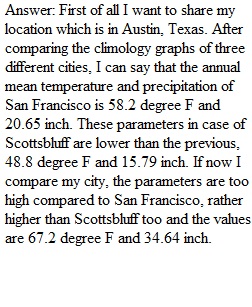


Q What to submit for this laboratory assignment: Copy, paste, and save your answers to the discussion questions below. Discussion Question #1: (5 pts.) Write a paragraph describing how different the climates are in San Francisco, CA; Scottsbluff, NE; and the city nearest you. Include seasonal variation in your discussion. When is it the coldest and warmest? Discussion Question #2: (5 pts.) Write a paragraph comparing the mean daily temperature and total precipitation from the climate maps and the climographs. If there are differences, why do you think this happens? Discussion Question #3: (5 pts.) Use the available data to assess the water availability where you live. In Table 1, fill in what each measure of drought conditions indicate for your location. Discussion Question #3: (5 pts.) Use the available data to assess the water availability where you live. In Table 1, fill in what each measure of drought conditions indicate for your location. Measure Condition (drier or wetter than in previous years) Precipitation Wetter than previous year Root Zone Soil Moisture Drier than previous year Groundwater Storage decreased Streams and Rivers Wetter than previous year U.S. Drought Monitor Wetter than previous year Table 1. Climate and Drought Data Do you live in an area experiencing drought conditions based on figures 5–9? Are the conditions that you have observed about where you live, in terms of access to water, consistent with the observations made for your locale (from the maps) in this exercise? Table 2. Watershed Characteristics (5 pts.) Using the details recorded in Table 2, write a description of your watershed. Include information about the size and shape of the land (slope and elevation) and how the land is used. The description should summarize the information you gathered to answer question #4. Include the load cover characteristics, watershed area, slope, elevation, and use of dams if applicable.
View Related Questions