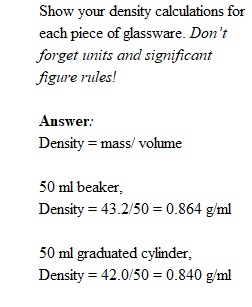


Q 1. Attach the properly formatted (see Graphical Analysis pg 23-24 of this manual) data table(s) and graph(s) of the pooled class data to this worksheet. Be sure the table(s) includes your average and standard deviation calculations. 2. Complete the following data table using the data you collected. Table 1: Individual Results for the Density of Coke or Diet Coke. Soda Type: Diet coke Mass Soda (g) Volume Soda (ml) Density Soda (g/ml) 50 mL Beaker 43.2 50 0.864 50 mL Graduated Cylinder 42.0 50 0.840 25 mL Volumetric Pipet 21.15 25 0.846 50 mL Buret 42.65 50 0.853 Calculations: Show your density calculations for each piece of glassware. Don’t forget units and significant figure rules! 3. Using Excel, calculate the mean and standard deviations for the pooled densities. Input the results into Table 2 below. Show one sample calculation (by hand) for the mean and standard deviation of Coke (not diet Coke) measured using the graduated cylinder method. 4. The accepted value for the density of Coke at 20 °C is 1.0423 g/mL and that of Diet Coke is 0.99821 g/mL. Calculate the percent error for each piece of glassware using the mean densities found in Question 3, and report your values in Table 2. Show full calculations for each glassware type below.5. Rank the glassware used from least to most precise. Briefly explain your order using data to support your answer. (Hint: think about the different calculations you’ve done and graphs you’ve made – what do they represent?)
View Related Questions