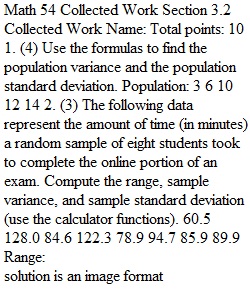


Q Math 54 Collected Work Section 3.2 Collected Work Name: Total points: 10 1. (4) Use the formulas to find the population variance and the population standard deviation. Population: 3 6 10 12 14 2. (3) The following data represent the amount of time (in minutes) a random sample of eight students took to complete the online portion of an exam. Compute the range, sample variance, and sample standard deviation (use the calculator functions). 60.5 128.0 84.6 122.3 78.9 94.7 85.9 89.9 Range: Sample Variance: Sample standard deviation: 3. (3) SAT Math scores have a bell-shaped distribution with a mean of 515 and a standard deviation of 114. a. What percent of SAT scores is between 401 and 629? b. What percentage of SAT scores is greater than 743? 1
View Related Questions